Demographics & Population Of South Korea
At What Age Do South Koreans Marry On Average? How Many Foreigners Are Now Naturalized South Korean Citizens?


Have you ever been curious about the population and demographics of South Korea? Do you know at what age Koreans get married on average, and how many multicultural families with a foreign spouse there are in the country?
We have put together statistics to satisfy that curiosity! Let's learn about South Korea's population, average marriage age and more below!
POPULATION OF SOUTH KOREA
Total Population
(As of December 2020)
| Total Population | Male | Female |
51,829,023 | 25,841,029 | 25,987,994 |
According to data from Statistics Korea, the total population of South Korea in December 2020was 51,829,023. This makes it the 28th most populous country in the world.
Looking at the gender distribution, there were 25,841,029 men and 25,987,994 women, meaning that there were slightly more women than men.
Population By Region
(As of December, 2020)
| NATIONAL TOTAL | 51,829,023 |
Metropolitan Cities | Population |
| Seoul | 9,668,465 |
| Busan | 3,391,946 |
| Daegu | 2,418,346 |
| Incheon | 2,943,828 |
| Gwangju | 1,450,062 |
| Daejeon | 1,463,882 |
| Ulsan | 1,136,017 |
| Sejong | 335,831 |
| Provinces | Population |
| Gyeonggi Province | 13,427,014 |
| Gangwon Province | 1,542,840 |
| North Chungcheong Province | 1,600,837 |
| South Chungcheong Province | 2,121,029 |
| North Jeolla Province | 1,804,104 |
| South Jeolla Province | 1,851,549 |
| North Gyeongsang Province | 2,639,422 |
| South Gyeongsang Province | 3,340,216 |
| Jeju Province | 674,635 |
Source: KOSIS
As of 2019, the most populous region in South Korea was Seoul, with about 18% of the total population concentrated in the capital city (Gyeonggi Province has a larger population, however it covers a large area with 31 cities and counties, and Seoul is the most populous city.).
In contrast, Sejong was the least populated area that got a separate mention in the statistics.
Sejong is a newly built city, created in 2012 in an effort to disperse the population of Seoul. It is the first "Special Self-Governing City" in the country, and although its population is quickly growing, it has yet to catch up to other major cities.
Population Projection Of South Korea
 Source: KOSIS
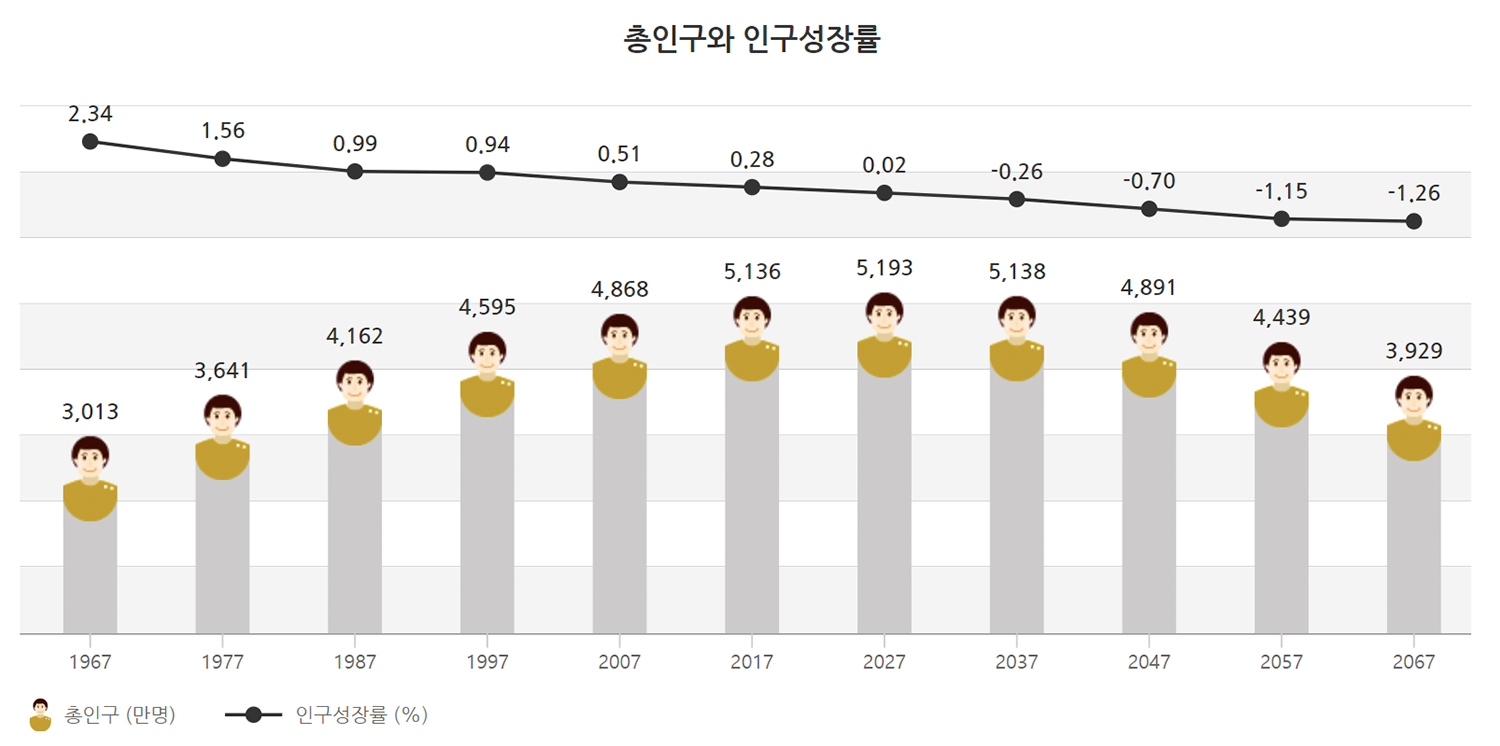
The next data is a forecast of the total population (unit: 10,000 people) and population growth rate of South Korea until 2067. The bars represent the total population, and the line above them represents the population growth rate.
A country's population fluctuates as a result of births, deaths, migration and immigration. South Korea's population is expected to decrease starting 2019 due to low birth rates and a rapidly aging population.
The population of South Korea is expected to go from 51.36 million in 2017 to 51.94 million in 2028, and from there decline to 39.29 million in 2067.
AVERAGE AGE BY CITY
Region | Average Age |
South Korea | 42.4 |
Busan | 44.2 |
Daegu | 42.7 |
Seoul | 42.4 |
Jeju | 41.6 |
Incheon | 41.5 |
Daejeon | 40.8 |
Ulsan | 40.8 |
Gwangju | 40.7 |
Sejong | 36.5 |
The next table gives us the average age of the populations in major cities in South Korea.
According these statistics, released by the South Korean Ministry of the Interior and Safety, the average age of a South Korean is 42.6 years. The statistics also tell us that the average age has risen by 0.5 years since the previous year.
If we exclude the aforementioned new city of Sejong, which has an average age of 36.9, the population of all 16 regions across the country had an average age of more than 40 years.
This means that South Korea's birth rate is gradually falling, and its population is rapidly aging, with an increasing number of middle aged and elderly population.
BIRTH & DEATH RATES
South Korea's Birth Rate
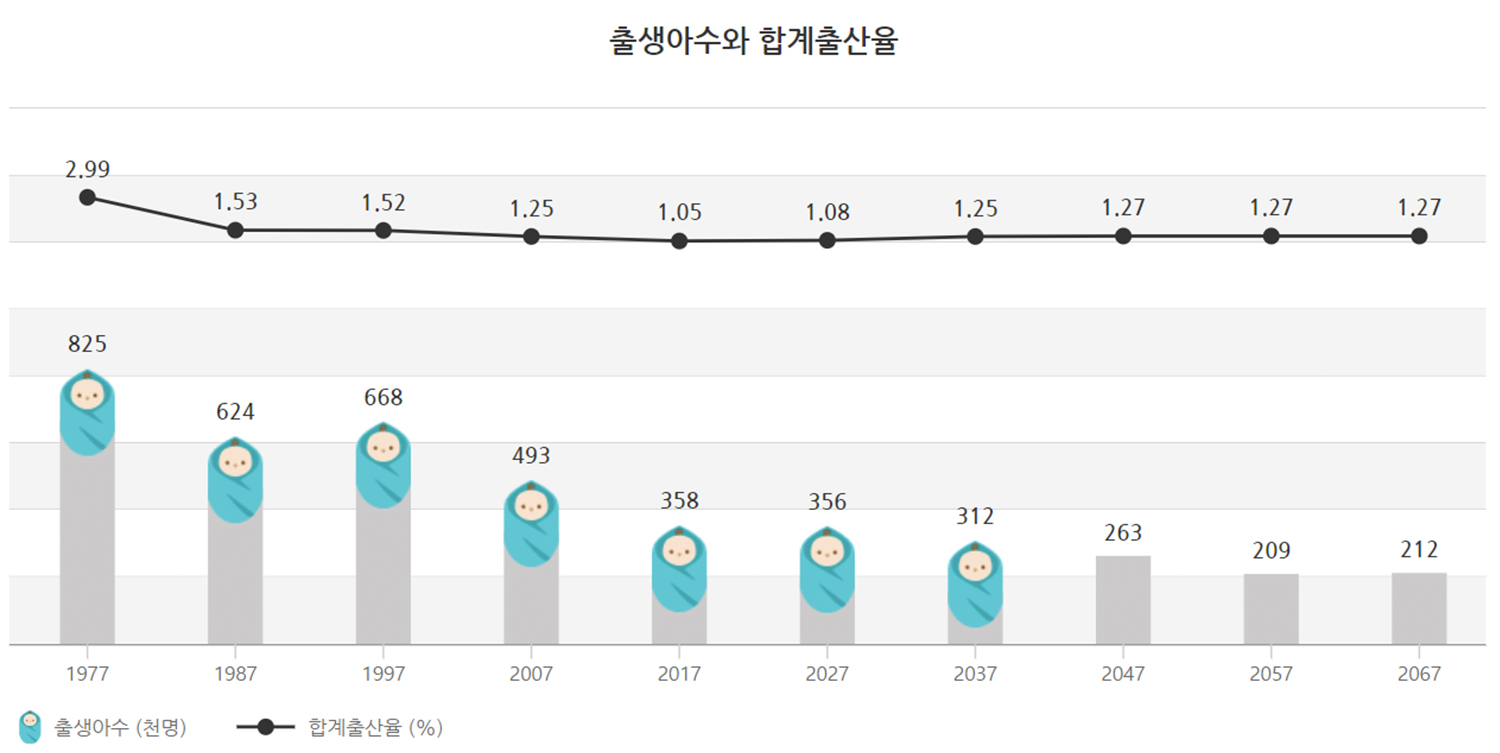
The bars in the graph above represents number of births (thousands), and the line above them represents fertility rate.
The annual number of births in South Korea dropped from over 700,000 in the early 1990s to 350,000 in 2017. Births are expected to continue to drop, with an estimate of 290,000 births by 2021, and 210,000 by 2067.
The fertility rate, which averages the number of children that will be born per woman, is also decreasing. South Korea has been at "lowest-low fertility" (less than 1.3 children per woman) since 2002. In 2018, it recorded less than 1 for the first time (0.98).
(Data for 2018 and before are based on population surveys, and 2019 and forward are population estimates for the future.
Number Of Births And Deaths In South Korea
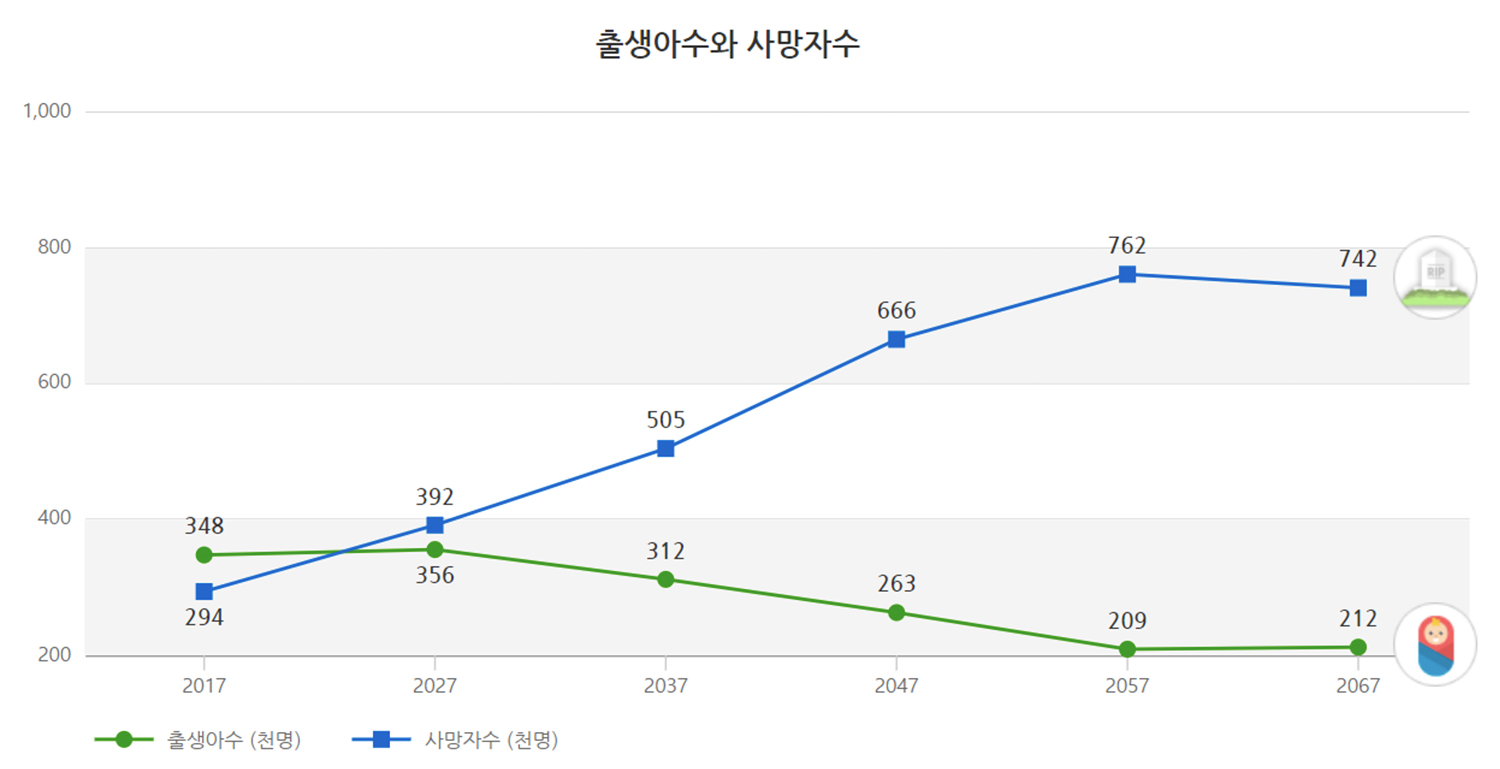
The blue line in the graph above shows the annual number of deaths (thousands), and the green line shows the annual number of births (thousands) in South Korea.
According to the graph, the number of deaths in South Korea remained steady around 240,000 for almost 30 years, but the number has been increasing since 2010.
The number of deaths is expected to increase from 290,000 in 2017 to more than 400,000 in 2028. By 2067, it is expected to rise to 740,000, or 2.5 times more than in 2017.
South Korea's population is expected to naturally decline starting 2019, as the number of deaths is expected to be higher than the number of births.
Life Expectancy Of South Koreans
The next graph shows the life expectancy of South Koreans: the blue line represents men's life expectancy and the red line that of women.
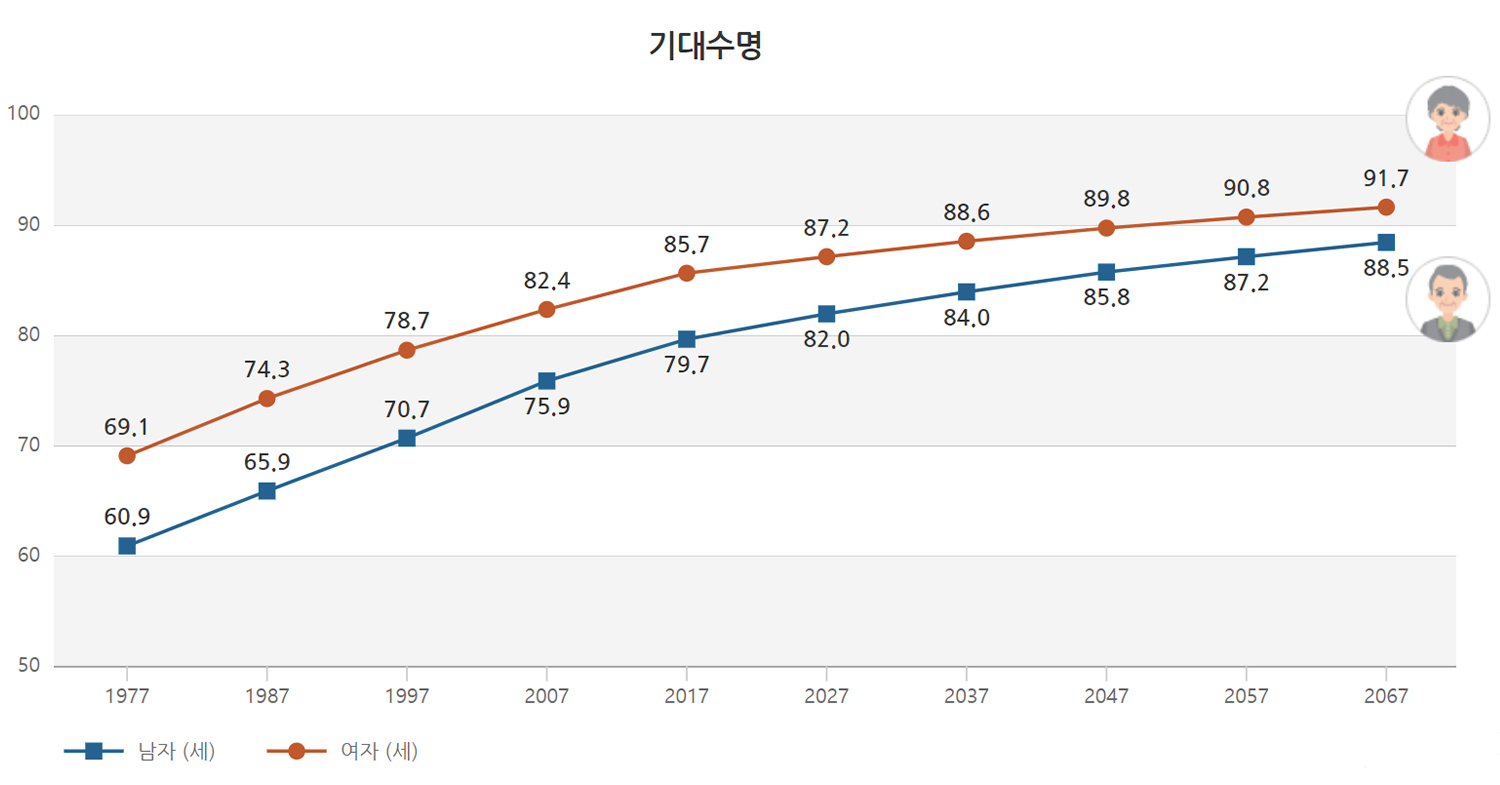
In 1977, the average life expectancy in South Korea was 60.9 years for men and 69.1 years for women. In other words, there was a gap in expected life spans of more than 8 years between sexes.
However, in the most recent data (2017), life expectancy had increased to 79.7 years for men and 85.7 years for women, with the gap between genders decreasing slightly to about 6 years.
Based on these trends, the average life expectancy is expected rise to 88.5 years for men and 91.7 years for women by 2067, with the difference between sexes decreasing.
MARRIAGE & DIVORCE
According to numbers presented by Statistics Korea in 2019, the number of marriages in South Korea that year decreased by 7.2%, and at the same time the number of divorces increased by 2.0% compared to the previous year.
In comparison, the number of international marriages between a Korean and a foreign citizen increased by 4.2% compared to the previous year, and the number of divorces for these marriages actually decreased by 3.4%. We will go through the details below.
Average Age Of First Marriage In South Korea
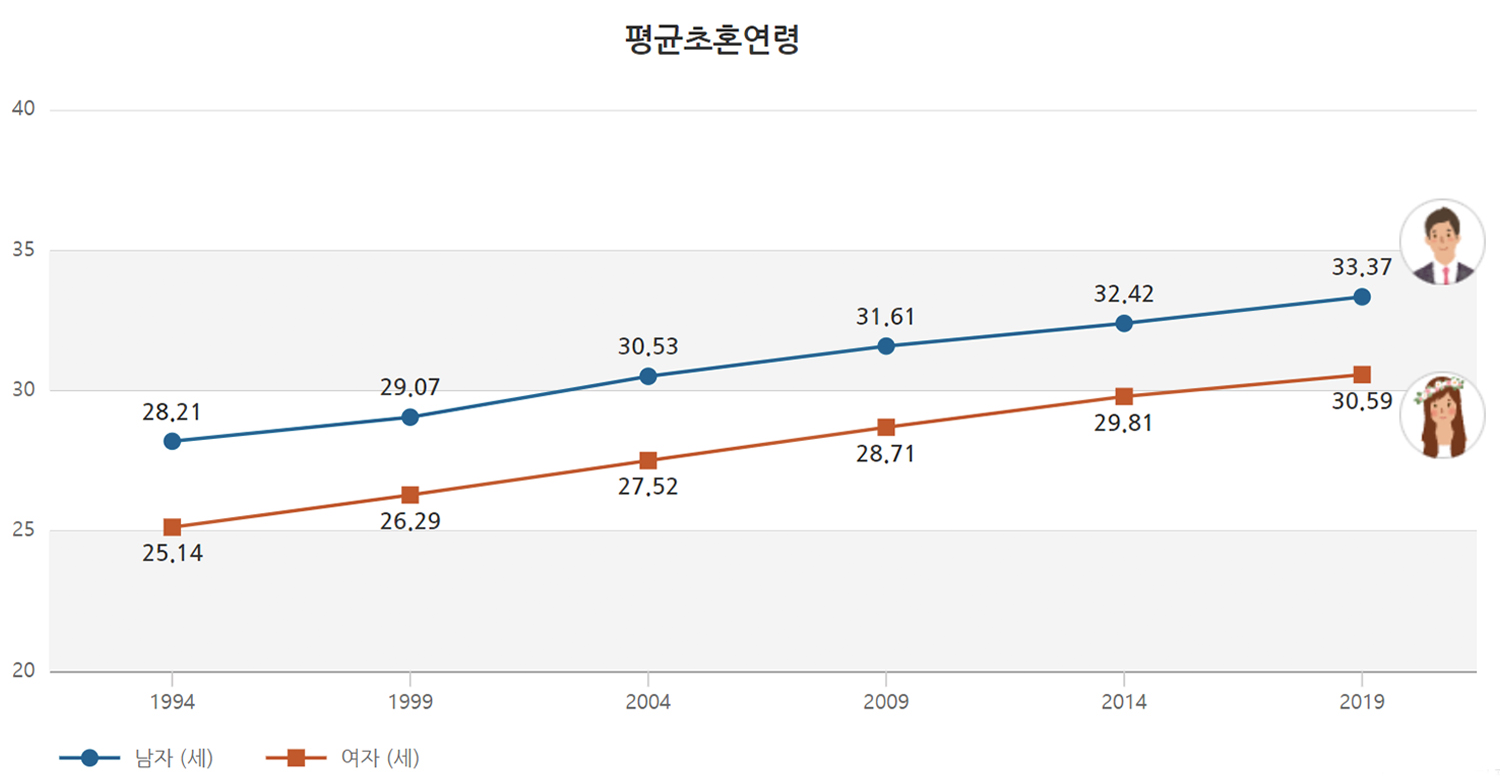
The graph above shows the average age of first marriage in South Korea. The blue line represents men and the red line represents women.
In 1994, the average age of first marriage was 28.21 years for men and 25.14 years for women. This had increased in 2019, when men averaged 33.37 years and women first married at 30.59 years old.
Nowadays getting married even in one's late twenties is considered early, and we can clearly see that the attitude toward first marriage in South Korea has changed since the 90s.
We have heard that in the 80s and 90s, you would be considered a spinster or old bachelor without any prospect of marrying if you weren't married at least before your turned 40.
In recent years, the number of people who remain unmarried throughout their 30s have increased, and words such as spinster are used less frequently.
Total Number Of Marriages And Crude Marriage Rate
*Crude Marriage Rate: Number of marriages per 1,000 people
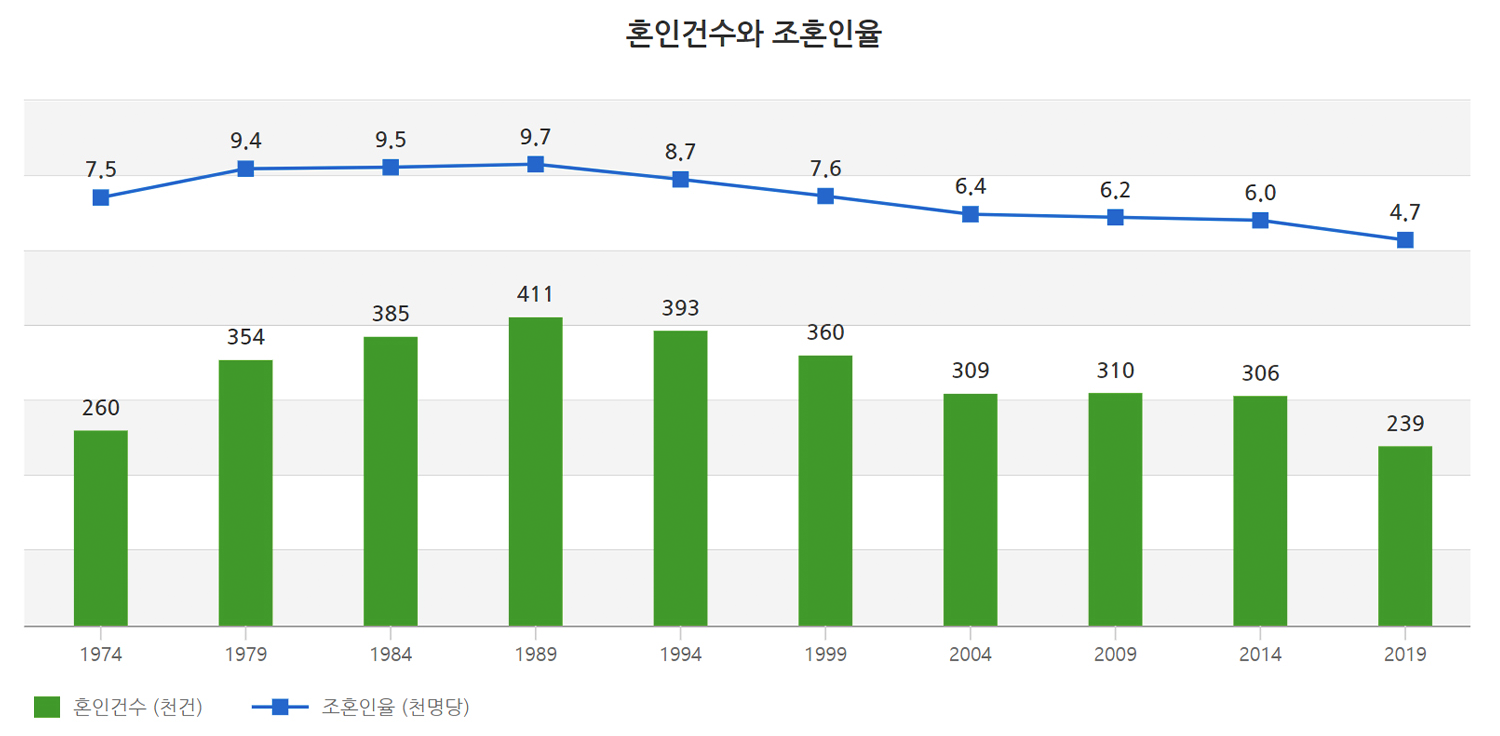
The next graph deals with the total number of marriages in South Korea, as well as their crude marriage rate. The green bar represents the total number of marriages per year (thousands), and the blue line graph represents the number of marriages per 1,000 people.
The number of marriages in South Korea has been rapidly decreasing since reaching a peak of 435,000 in 1996. In 2019, only 239,000 marriages were recorded, down 7.1% (-18,000) from the previous year.
Apparently the number of marriages have dropped for eight consecutive years since 2012.
Furthermore, the crude marriage rate, which represents the number of marriages per 1,000 people, stood at 4.7 in 2019, down 0.3 points from the previous year.
Average Age Of Divorce
Next, we will take a look at the average age of divorce in South Korea.
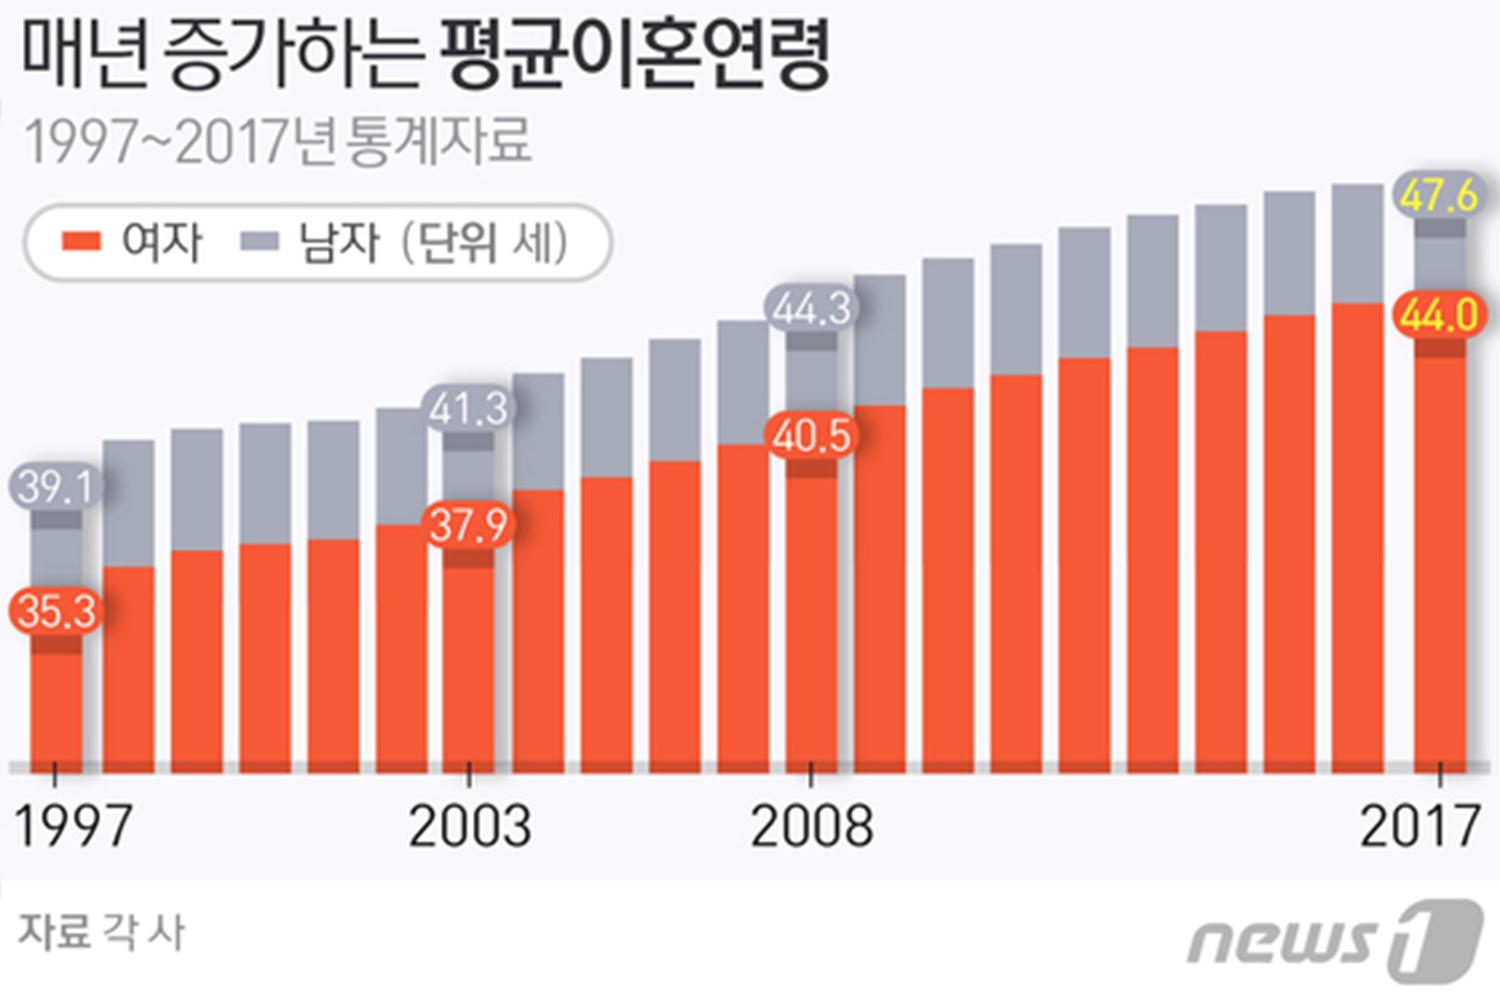
As we can see, the average age at which South Koreans get a divorce has been gradually increasing.
In 1997, the average divorce age in Korea was 39.1 years for men and 35.3 years for women. By 2017, this has increased to 47.6 years for men and 44.0 years for women, an increase of 7-8 years.
This seems to have been influenced by the increase of average age of first marriage.
International Marriages
The next data concerns international marriages in South Korea. In other word, marriages between a South Korean and a foreign citizen.
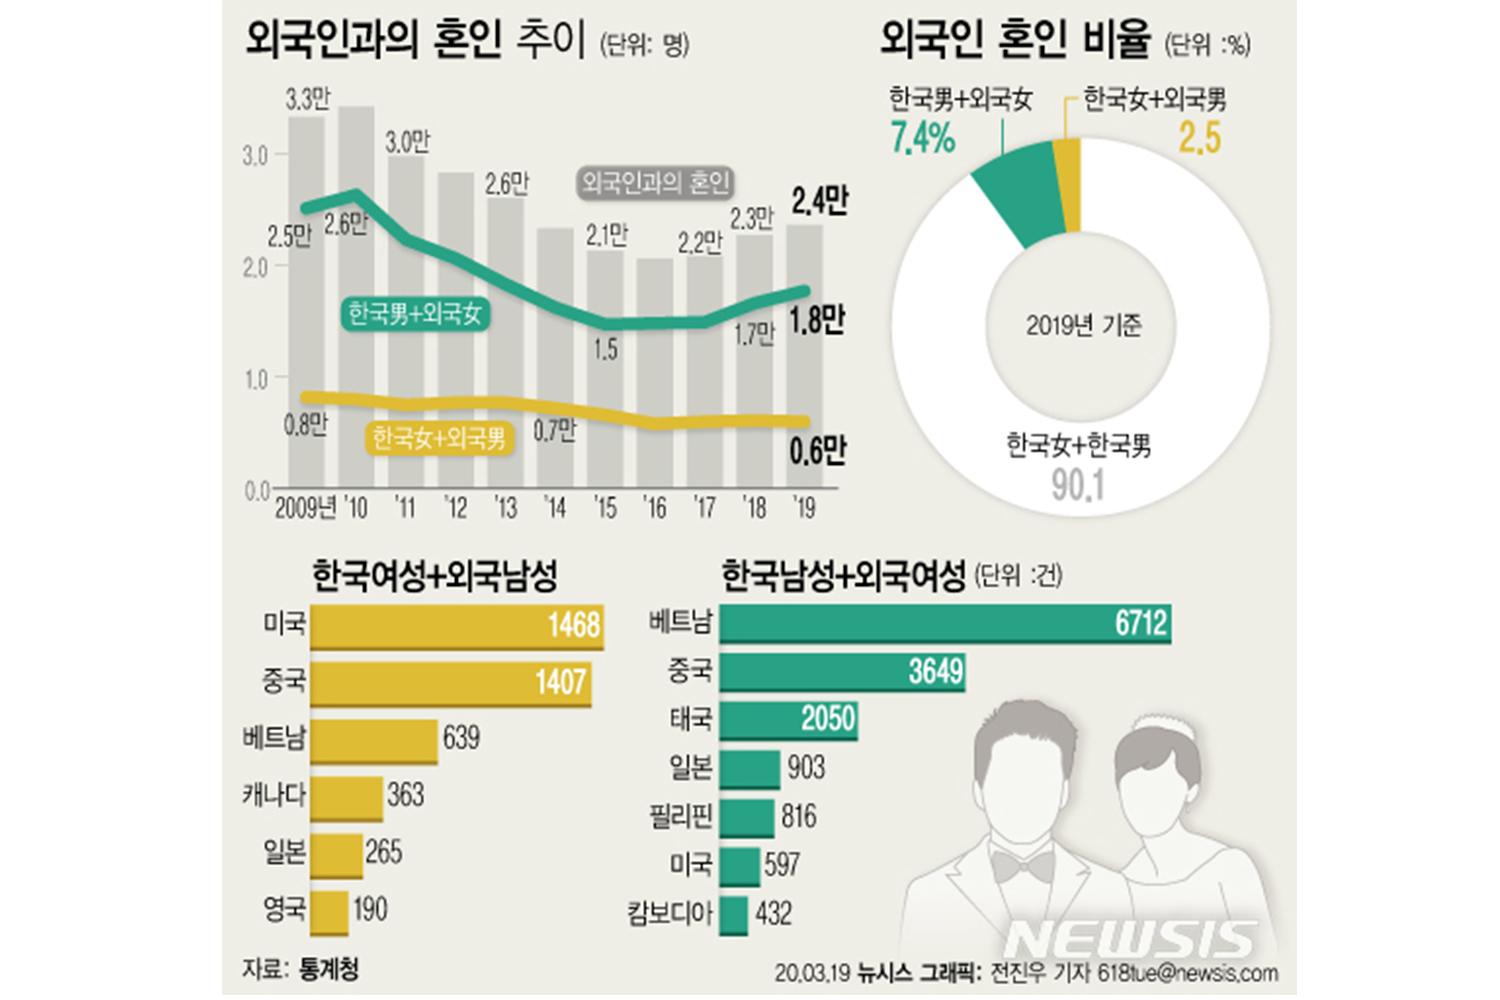
According to the data, the number of international marriages gradually decreased after having peaked at 33,000 marriages in 2009. However, from 2017 they have been increasing again, and 24,000 cases were recorded in 2019.
Furthermore, as of 2019, international marriages accounted for about 10% of the total number of newly registered marriages in South Korea. Marriages between a Korean man and a foreign woman represented 7.4% of all marriages, and marriage between a Korean woman and a foreign man made up an additional 2.5%.
For the combination Korean wife and foreign husband, the most common nationalities for the husband were in the order of the United States, China, Vietnam, and Canada.
For marriages between a Korean husband and a foreign wife, the most common foreign nationalities were Vietnam, China, Thailand, and Japan.
MULTICULTURAL FAMILIES
As of 2019, the number of multicultural household members in Korea totaled 1,062,000, of which 649,000 were Koreans born in South Korea.
Another 357,000 people were so called multicultural family members (marriage immigrants or naturalized citizens). The remaining 55,000 were foreigners who are in South Korea on other visa or terms.
Marriage Immigrants
*Foreigners living in South Korea who have been married to or are married to South Korean citizens
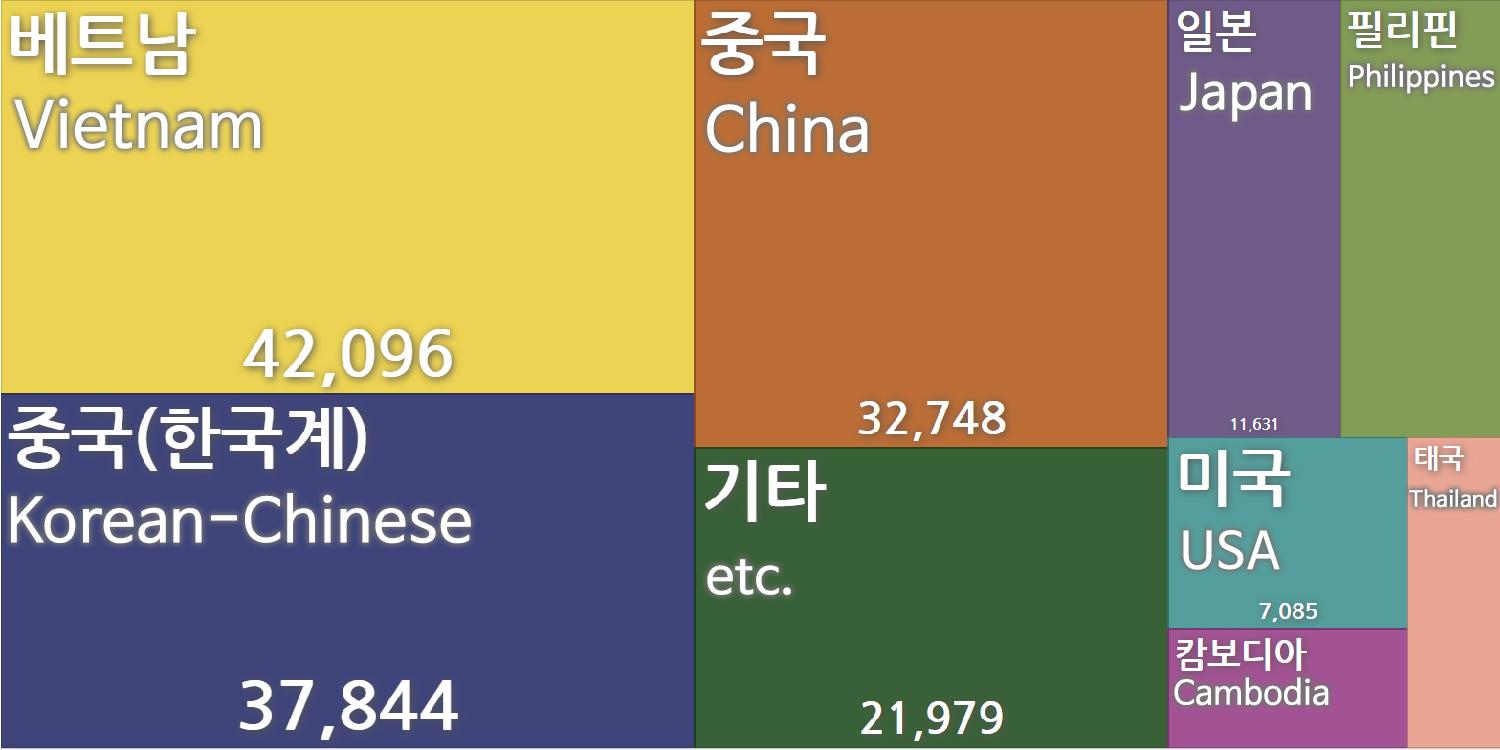
There are currently 173,085 marriage immigrants in South Korea.
Of these, immigrants with Vietnamese nationality make up the biggest group with 42,096 people (24.32%), followed by Chinese (Korean descent) with 37,844 (21.86%) and Chinese with 32,748 (18.92%)
Naturalized Foreigners
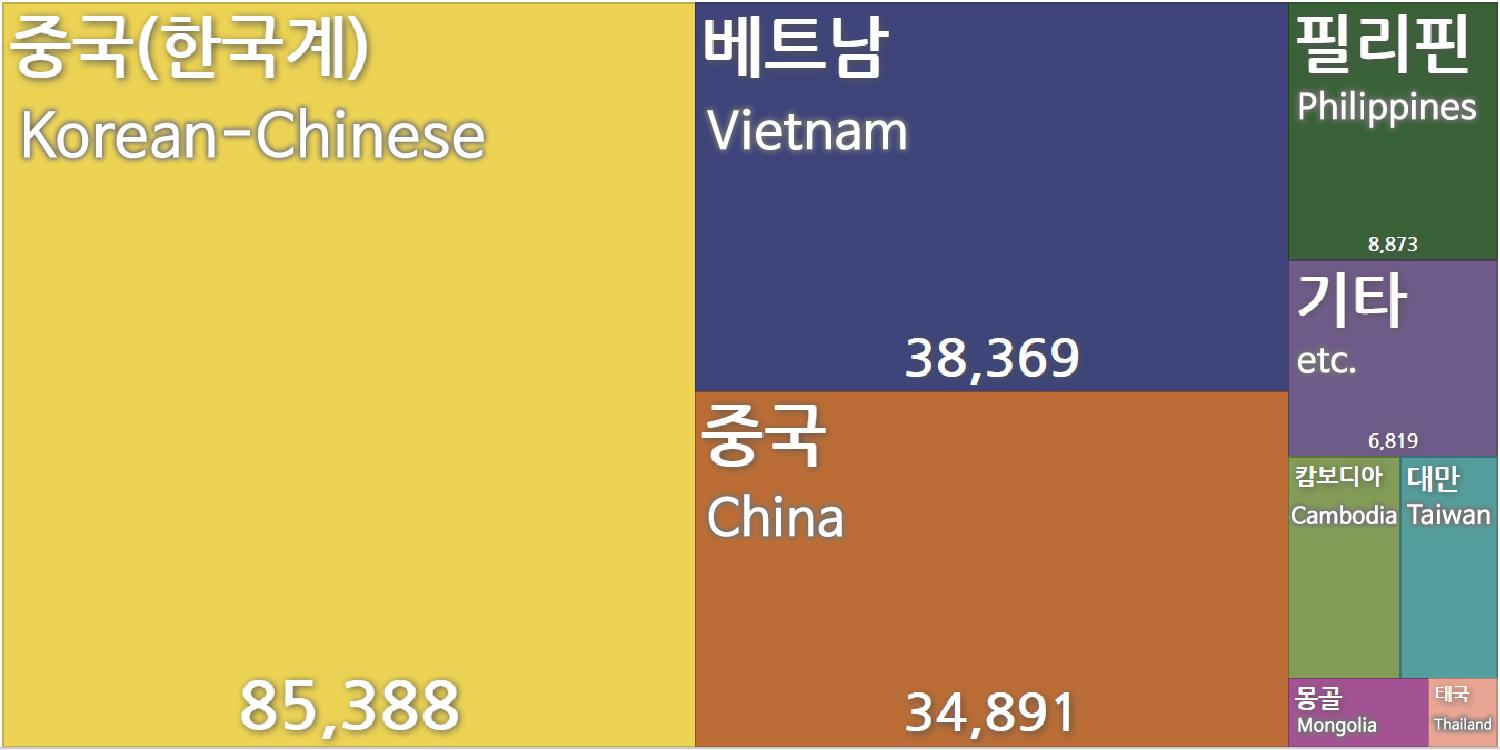
The above data shows the former nationalities of foreign born citizens, now part of multicultural families, who have been naturalized South Korean citizens.
According to Statistics Korea, as of 2019, a total of 184,446 members of multi-cultural families had been naturalized.
Before naturalization, the most common citizenships were Chinese (Korean descent) with 85,388 people (46.3%), Vietnamese with 38,369 (20.8%) and Chinese with 34,891 (18.9%).
In this article we took a look at statistics of the demographics of South Korea. We hope that you found it interesting!
If you have questions or comments about the blog post, please leave a comment below or email us at help@creatrip.com.
Book all things trending in Korea on Creatrip! If you have any questions or concerns, please leave a comment below or send us an email at help@creatrip.com! You can follow us on Instagram, TikTok, Threads, and Youtube to stay updated on all things Korea!